Mondelez International — Data UX
Rediseñar dashboards de Power BI para hacer más clara la información compleja de Sell-In y Sell-Out de cara a las decisiones de negocio.
Colaboré en el rediseño UX de dashboards de Power BI con datos de Sell-In y Sell-Out. Estructuré la información para tres perfiles de negocio (ejecutivo, táctico y operativo) y mejoré la navegación, la jerarquía y la accesibilidad de los datos, todo en un tiempo de entrega corto.
Empresa
Mondelez International
Industria
Data UX / Bienes de consumo / Business Intelligence
Rol
UX Designer — Data UX
Tipo de producto
Dashboards de Power BI / Herramienta de business intelligence
Duración
May 2025 – Jun 2025
Equipo
UX, Data/BI, Stakeholders del cliente, Usuarios de negocio, Product/Delivery
Métodos
Análisis de necesidades de stakeholders, Arquitectura de información, Dashboard UX, Wireframes, Visualización de datos, Accesibilidad, Validación con cliente
Herramientas
Power BI, Figma, FigJam, Claude
Estado
Dashboards entregados / Bajo NDA
Confidencialidad
Parte de este proyecto está bajo NDA: los datos, KPIs y contenido sensible de los dashboards aparecen difuminados o simplificados. Puedo compartir más detalle en una entrevista o revisión de portafolio.
Contexto
Mondelez International necesitaba mejorar la UX de los dashboards de Power BI usados para analizar datos de Sell-In y Sell-Out. Los dashboards debían servir a usuarios con tres niveles de decisión distintos: ejecutivo, táctico y operativo.
El tiempo de entrega era corto y el contexto de datos, complejo: había que entender la información rápido, identificar qué necesitaba cada perfil y traducirlo en dashboards más claros.
Por qué importaba
El trabajo de fondo fue entender cómo lee los datos cada usuario de negocio, qué decisiones necesita tomar y cómo la arquitectura de información podía reducir la carga cognitiva en un entorno saturado de datos.
Mi rol
Trabajé como UX Designer con foco en Data UX, dentro de un equipo más amplio de datos y BI.
- Analicé las necesidades de los stakeholders a partir de investigación previa y del contexto del cliente.
- Estructuré experiencias de dashboard para usuarios ejecutivos, tácticos y operativos.
- Diseñé la interfaz visual (jerarquía, tipografía y una paleta de color accesible) para mejorar la legibilidad de los datos.
- Exploré wireframes y alternativas de layout.
- Validé las propuestas con el cliente y ajusté según su feedback.
El reto
El principal reto era transformar datos de negocio complejos en dashboards útiles para distintos niveles de decisión, sin abrumar a los usuarios.
- Reto de usuario: cada perfil necesitaba un nivel de detalle distinto en una experiencia que siguiera siendo clara y fácil de navegar.
- Reto de negocio: la información de Sell-In y Sell-Out tenía que ser más fácil de leer y usar para decidir.
- Reto de diseño: había que entender un contexto de datos complejo y entregar propuestas útiles en poco tiempo.
Problem statement
¿Cómo podríamos ayudar a los usuarios de negocio a entender y navegar los datos de Sell-In y Sell-Out, cubriendo las necesidades de decisión de los niveles ejecutivo, táctico y operativo?
Objetivos y criterios de éxito
Objetivos de usuario
- Encontrar el nivel de información adecuado para cada rol.
- Reducir la carga cognitiva al leer datos complejos.
Objetivos de negocio
- Hacer los dashboards más útiles para decidir en cada perfil de usuario.
- Mejorar la consistencia y la legibilidad de los reportes de Power BI.
Objetivos de diseño
- Definir estructuras de dashboard por nivel de decisión.
- Mejorar la jerarquía y la navegación con criterios de accesibilidad, incluido el color.
- Validar alternativas con el cliente e iterar.
Proceso
01 — Descubrir
Entender a los usuarios y el contexto de datos
Empecé por entender el contexto del dashboard, el tipo de datos involucrados y los usuarios que interactuarían con él.
- Revisé la investigación previa y la información de los stakeholders.
- Identifiqué las necesidades de los usuarios ejecutivos, tácticos y operativos.
- Analicé las diferencias entre el uso de los datos de Sell-In y Sell-Out.
- Mapeé dónde la estructura, la navegación y la jerarquía necesitaban mejoras.
Cómo usé la IA
Usé Claude como espacio de trabajo del proyecto: centralicé la información relevante, entendí más rápido el contexto de datos e identifiqué qué aclarar antes de definir la estructura. Las decisiones finales fueron mías, basadas en criterios UX, accesibilidad y el feedback del cliente.
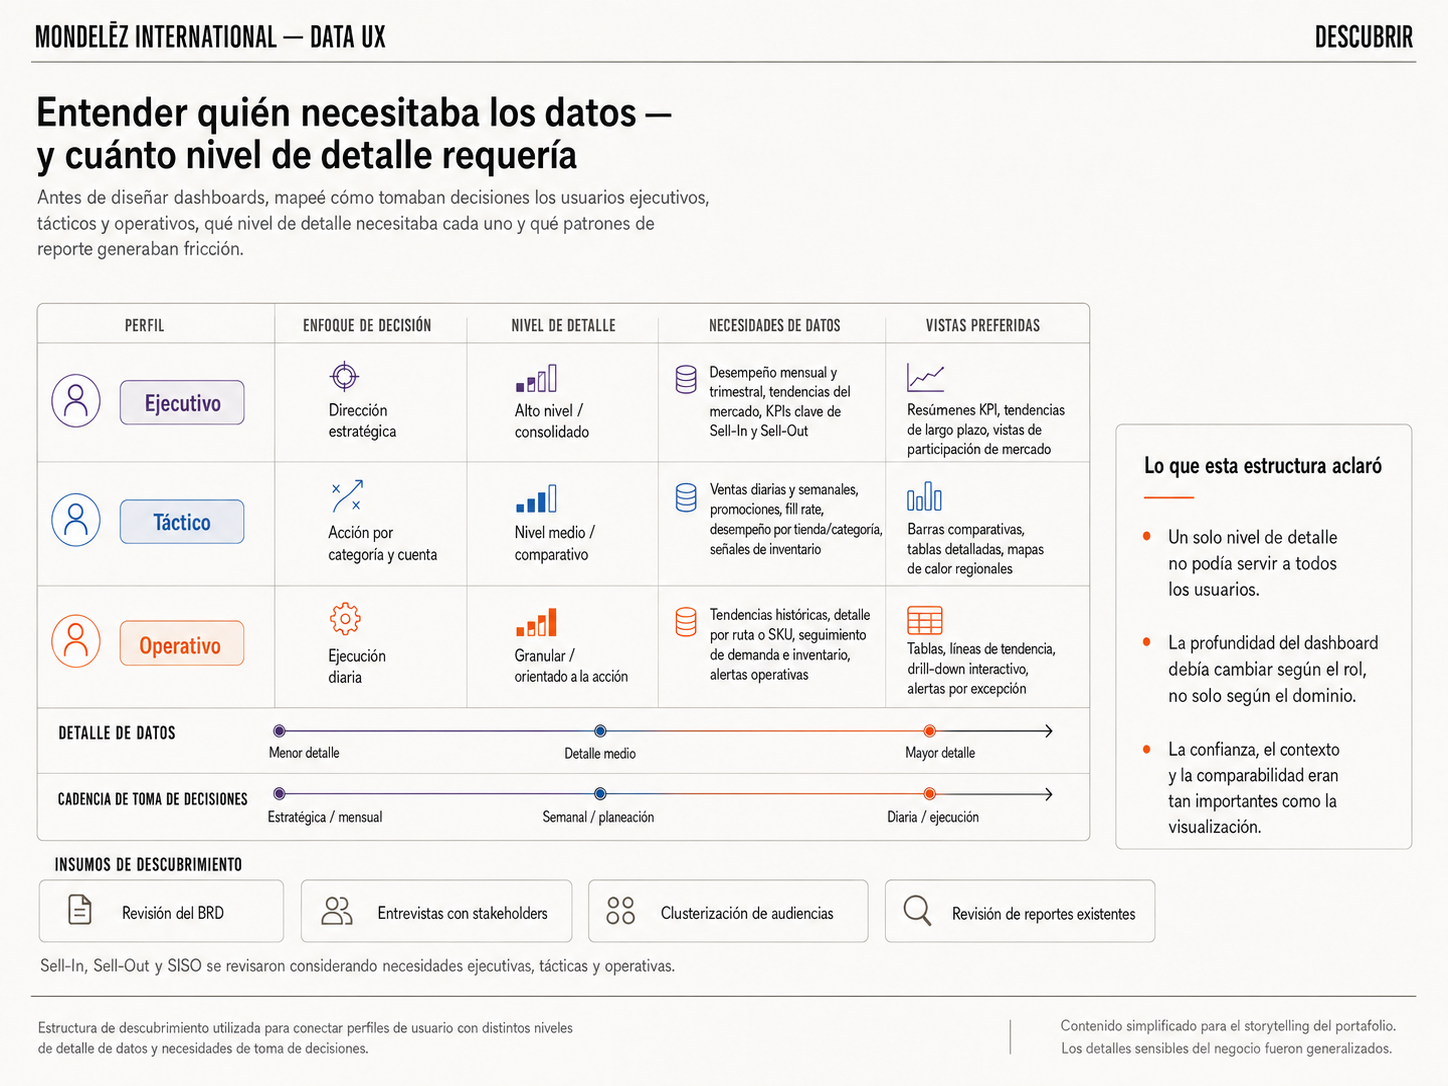
Estructura de discovery usada para conectar los perfiles de usuario con distintos niveles de detalle de datos y necesidades de toma de decisiones.
02 — Definir
Traducir las necesidades de negocio en estructura de dashboard
Con los usuarios y el contexto claros, definí estructuras de dashboard para cada nivel de decisión, de modo que la información fuera más fácil de escanear e interpretar según el rol.
- Sinteticé las necesidades de los stakeholders en tres niveles de usuario: ejecutivo, táctico y operativo.
- Definí estructuras diferenciadas y prioricé la jerarquía de información según las decisiones de cada rol.
- Alineé la estructura propuesta con el cliente antes de pasar a la exploración visual.
Cómo usé la IA
Usé Claude para organizar los inputs de los stakeholders y explorar formas de estructurar la información del dashboard.
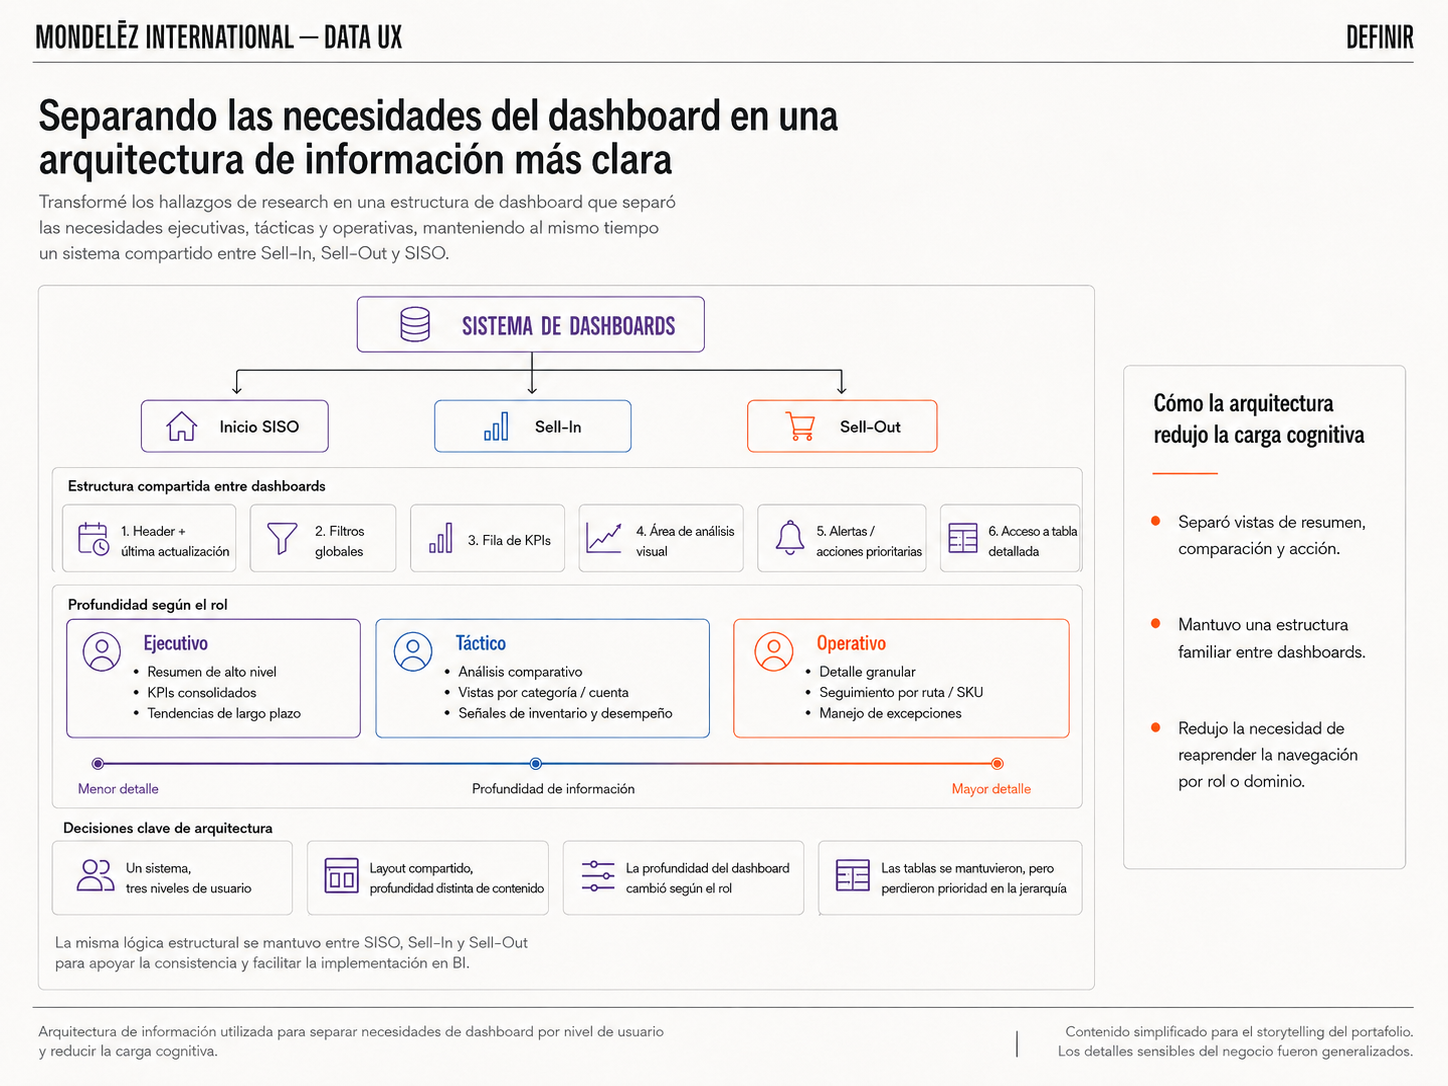
Arquitectura de información usada para separar las necesidades del dashboard por nivel de usuario y reducir la carga cognitiva.
03 — Desarrollar
Explorar wireframes para una lectura de datos más clara
Una vez definida la estructura, exploré wireframes y alternativas de layout para mejorar cómo los usuarios escanean la información y navegan entre vistas.
- Creé wireframes para los distintos niveles de usuario y mejoré la jerarquía del layout.
- Exploré patrones de navegación entre vistas y un uso de color accesible.
- Validé las ideas con el cliente y ajusté según su feedback.
Cómo usé la IA
Usé Claude para generar ideas de wireframes a partir del contexto del proyecto; las revisé, adapté y validé con el cliente antes de avanzar.
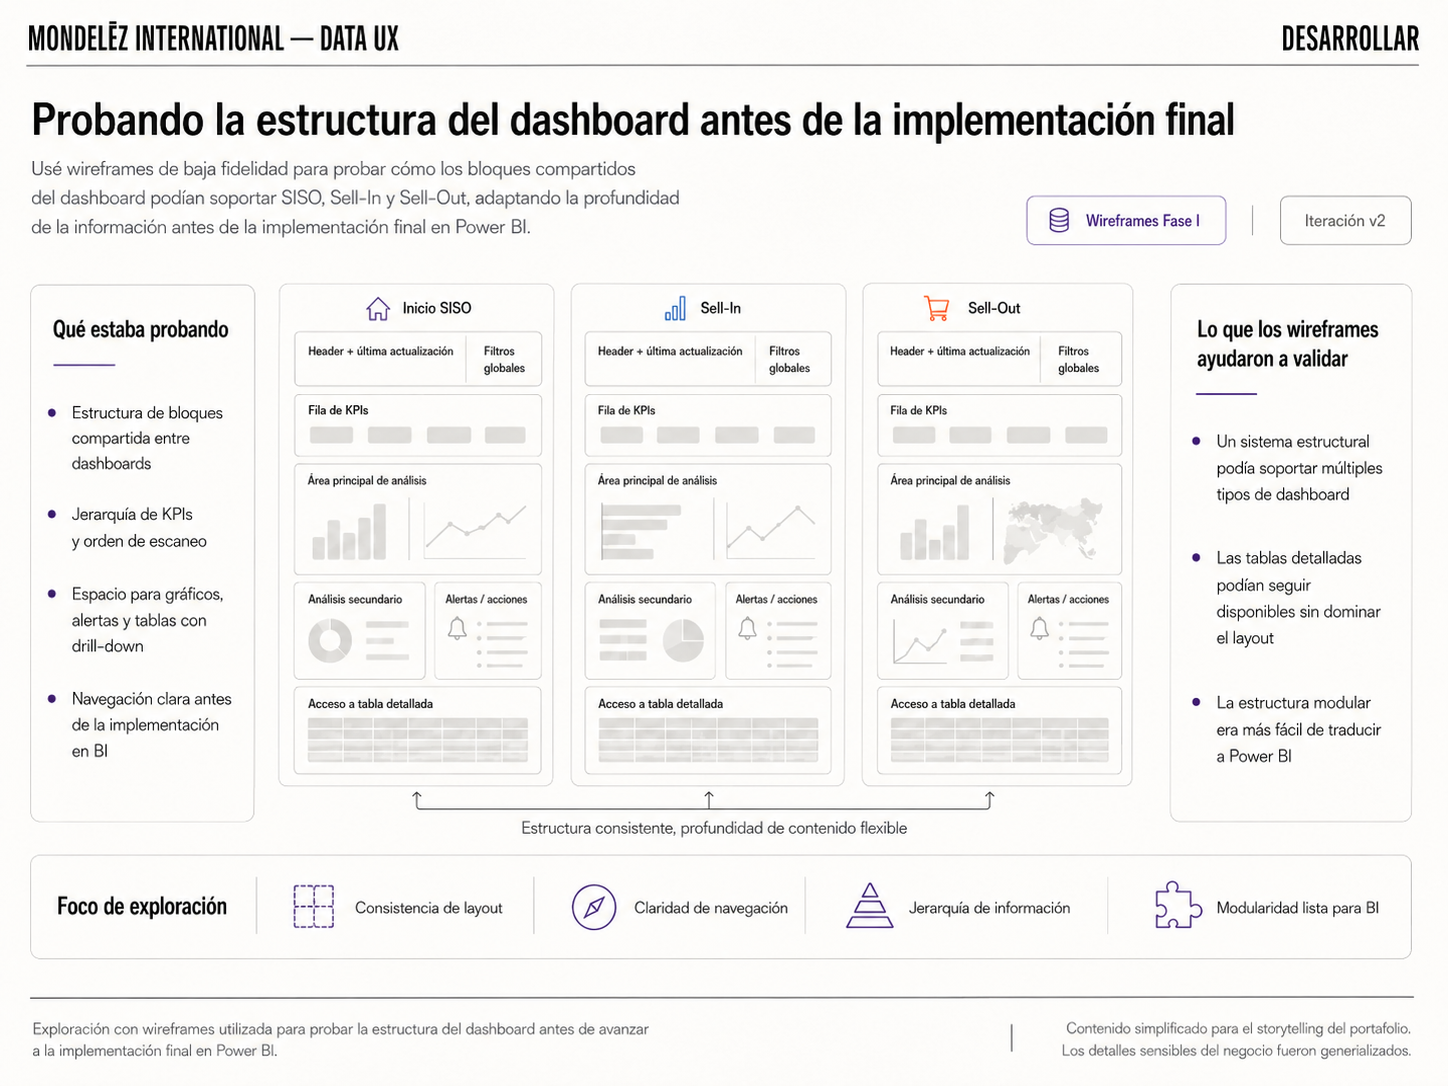
Exploración de wireframes usada para probar la estructura del dashboard antes de pasar a la implementación final en Power BI.
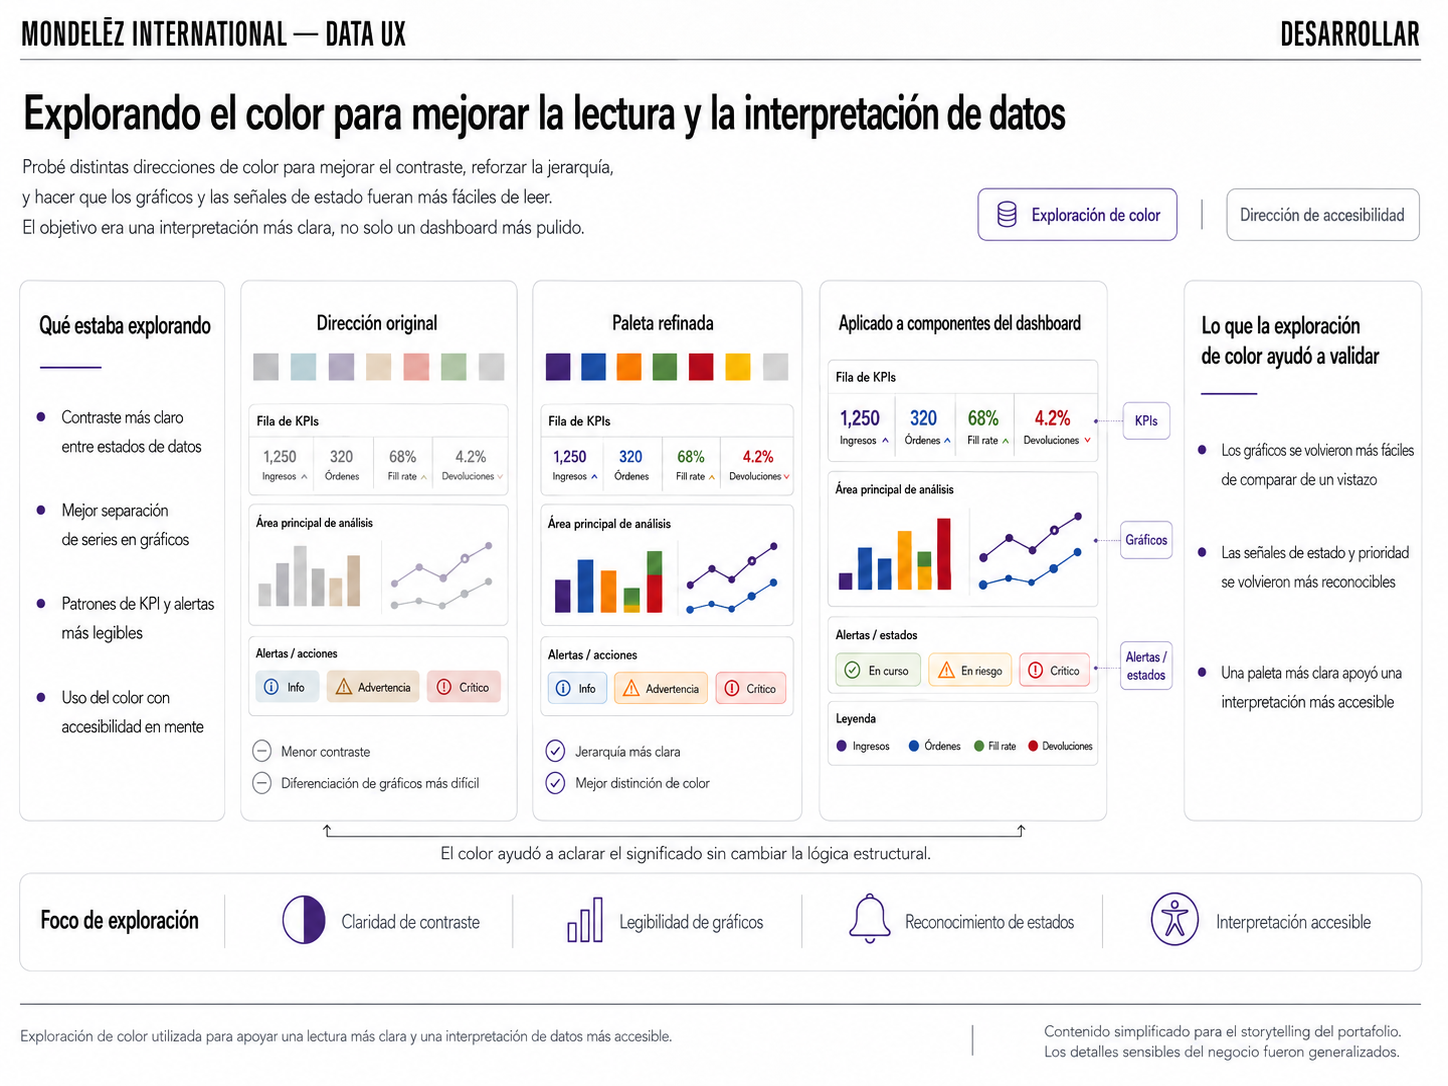
Exploración de color usada para apoyar una lectura más clara y una interpretación de datos más accesible.
04 — Entregar
Entregar dashboards más claros para cada nivel de decisión
El resultado fueron tres dashboards de Power BI a la medida de las necesidades ejecutivas, tácticas y operativas, con mejor navegación, claridad visual y accesibilidad.
- Entregué tres estructuras de dashboard, una por nivel de decisión.
- Mejoré la navegación y la jerarquía en las vistas de Sell-In y Sell-Out, con una paleta de color accesible.
- Contribuí a la documentación final y a las decisiones de diseño.
Cómo usé la IA
Usé Claude en el refinamiento final para revisar que la lógica del dashboard se mantuviera clara en los tres niveles de usuario.
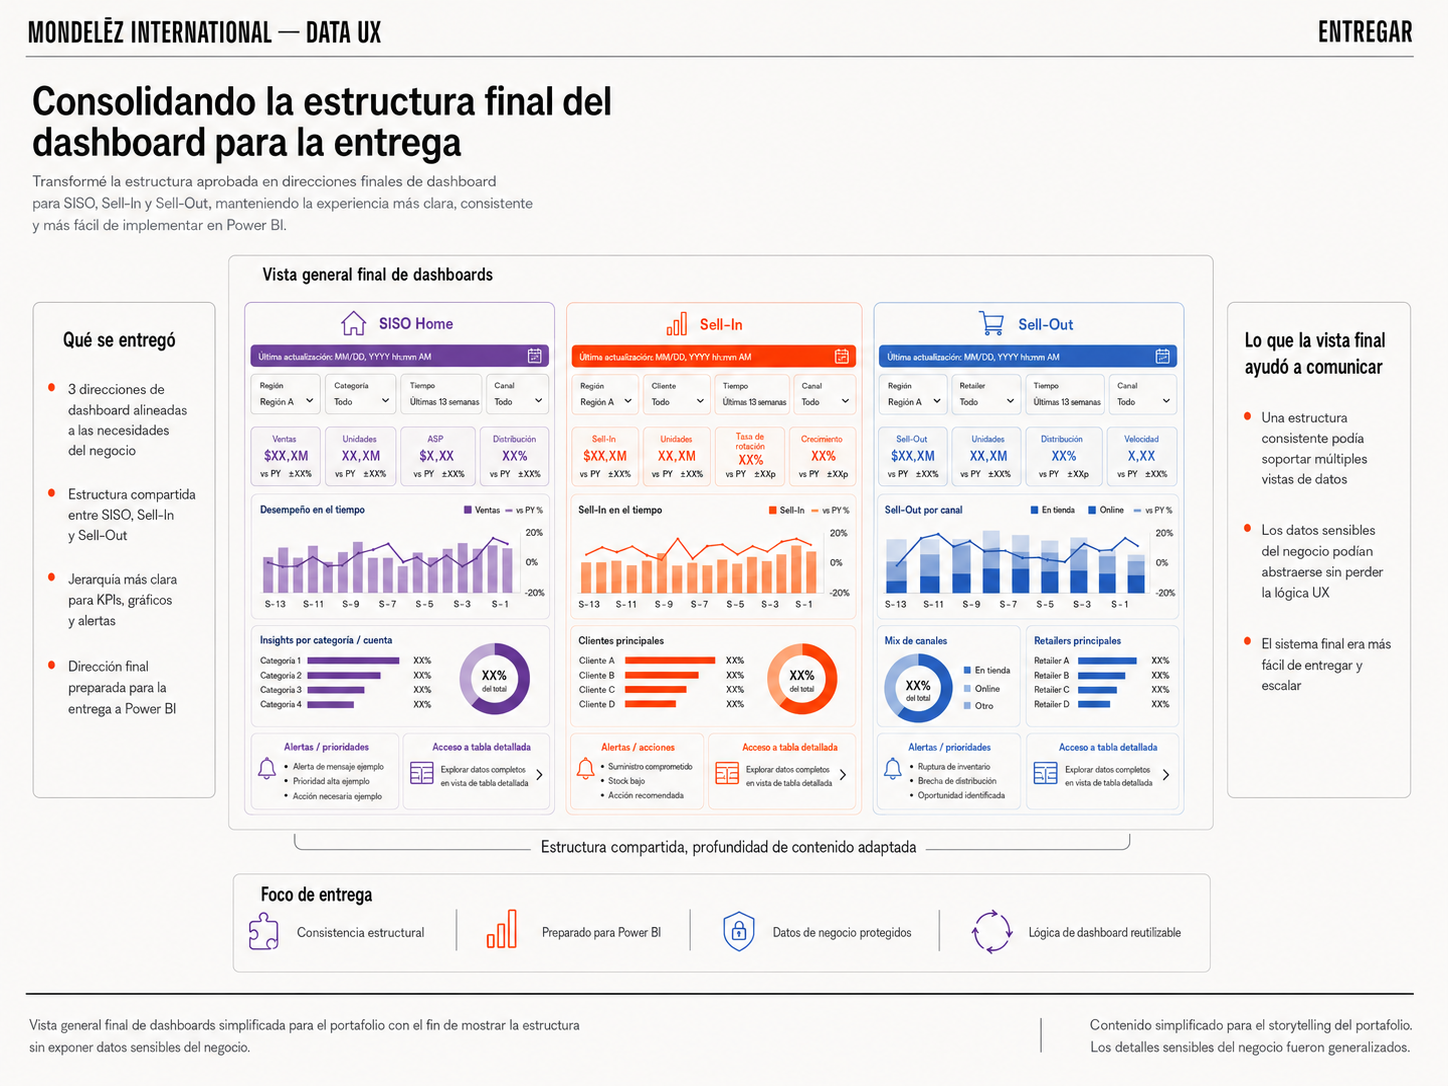
Vista general del dashboard final simplificada para fines de portafolio, mostrando la estructura sin exponer datos de negocio sensibles.
Antes / después
Antes
Una misma estructura de dashboard intentaba servir a todos los perfiles, y los datos de Sell-In y Sell-Out eran difíciles de escanear e interpretar.
Después
Los dashboards quedaron organizados por nivel de decisión (ejecutivo, táctico y operativo), con mejor navegación, jerarquía y accesibilidad.
Solución final
La propuesta se enfocó en tres mejoras:
Estructura de dashboard basada en roles
Los dashboards se organizaron por nivel de decisión, para que cada usuario acceda al nivel de información que necesita.
Jerarquía de información más clara
Los datos se priorizaron y agruparon para reducir la carga cognitiva en una experiencia muy densa.
Visualización de datos más accesible
Las decisiones de color y layout mejoraron la legibilidad y el acceso a la información de negocio.
Impacto y resultados
Valor para el usuario
Los usuarios de negocio acceden y entienden los datos de Sell-In y Sell-Out con estructuras más claras.
Valor de negocio
Tres dashboards a la medida de la toma de decisiones ejecutiva, táctica y operativa.
Valor de producto
Mejor navegación, jerarquía y accesibilidad de los datos en Power BI.
Valor de equipo / proceso
La IA aceleró el trabajo en un contexto de datos complejo, con decisiones validadas con el cliente.
Obstáculos y trade-offs
El equilibrio difícil estuvo entre densidad de datos, claridad, accesibilidad y velocidad de entrega: había que estructurar la información para cada perfil sin recortarla.
- Entender un contexto de datos complejo en poco tiempo.
- Diseñar para tres niveles de usuario con necesidades distintas.
- Equilibrar la densidad del dashboard con la legibilidad.
- Mejorar la accesibilidad sin perder el significado de negocio de los datos.
Qué aprendí
Data UX consiste en ayudar a la gente a entender la información más rápido y con más confianza, no en mostrar más datos.
- Aprendí a estructurar dashboards a partir de los roles de usuario, no de los datos disponibles.
- La IA me ayudó a entender un dominio complejo más rápido; la validación con el cliente siguió siendo insustituible.
- El UX de dashboards debe apoyar decisiones, no solo reporting.
- Gané confianza trabajando con Power BI y visualización de datos.
Este proyecto es un buen ejemplo de cómo manejo un contexto de datos denso y desconocido con poco tiempo: estructurarlo en torno a lo que los usuarios necesitan, apoyarme en la IA para ponerme al día más rápido, y convertir un muro de números en algo que la gente pueda usar.
Stephanie Cacheo — Senior Product Designer / UX Lead